3 million daily requests, zero CDN: optimizing CoMaps maps delivery
This post by Edoardo Codeglia is licensed under a Creative Commons BY-NC-ND 4.0 License and was first published on unfoxo.it
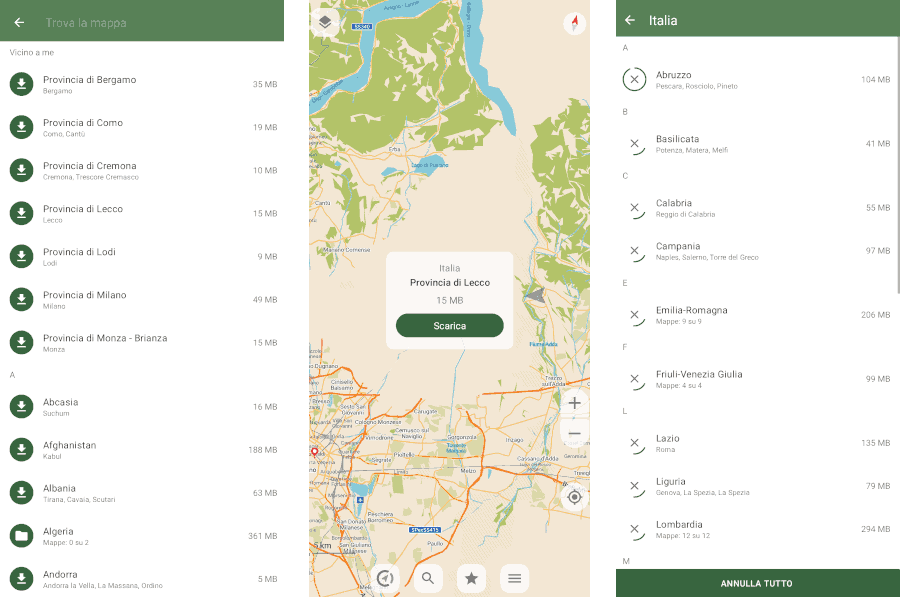
CoMaps is an open-source navigation app that uses OpenStreetMap data as its map base. One of its key strengths is its ability to work entirely offline, either by downloading maps in advance or as you explore.

The app provides compressed and distilled packages of OpenStreetMap data, containing only the information needed for everyday navigation. This way, with just a few gigabytes, maps are always available offline and ready to be searched directly on the device.
It is unclear how many active users there are (since there is no tracking or statistics), but providing high-quality maps on such a large scale and, above all, maintaining user privacy is an interesting infrastructural challenge.
CoMaps' goal is to shift away from commercial CDNs and run its own network of independent nodes managed directly by the project's volunteers. In this way, traffic would pass exclusively through individuals who are genuinely committed to and aligned with the project's goals, without any intermediaries.
Starting from April 2026, unfoxo provides CoMaps with the "comaps-it1" node.
Is it actually a CDN?
The goal of a CDN is to bring data as close as possible to the user: data is copied and distributed across multiple nodes that cover many different geographic areas. This way, no matter where the user is located, statistically there will be at least one node close enough to download the data as quickly as possible. Closer nodes also mean lower traffic costs and greater resilience.
The purpose of CoMaps' "CDN" is different: each client connects to random nodes and downloads only map regions in compressed format. This makes it almost impossible to determine a specific user's exact location by correlating their requests.
Furthermore, since states are divided into very coarse sections rather than "tiles" (the classic "squares" found in other navigation apps), in the worst-case scenario, only a very approximate location of the user can be determined.
The architecture of comaps-it1
In a CDN, the HTTP server acts as the intermediary between the user and the data; therefore, it must be efficient and optimized.
- File system: Bcachefs on SATA SSDs, with NVMe caching
- Operating system: Alpine Linux
- Web server: Nginx
For synchronization, the CoMaps team uses SFTP, which has been installed on a separate container with write permissions only for the folder that will then be served by the node.
Bcachefs was chosen for its ability to create a two-tier storage system: at the front, NVMe drives excel in speed and handle all writes and reads of the "hottest" data.
SATA SSDs, on the other hand, are used as storage for less frequently accessed data, providing the necessary space at a much lower cost and with greater longevity.
Alpine Linux was chosen for its lightness and simplicity: it is the operating system on which many Docker images are based, but it also excels as a base operating system and aligns very well with the "old school" approach to server management.
The web server is not a critical component: since bandwidth is the limiting factor for this project, any web server would likely have saturated it. In this case, I decided to use nginx due to familiarity and its ability to function both as a static server and as a proxy.
Performance Optimization
The server was initially run with default settings and logging enabled in order to establish a baseline. The server, supported by the SSD pool, was still able to saturate the WAN connection through which it was connected.
However, opportunities immediately appeared to further optimize the system: a lower load means lower energy consumption, longer component lifespan, and the ability to redirect that load toward other, more important tasks.
Pareto's Principle
Anyone who has dealt with large numbers is surely familiar with Pareto's Principle. Statistically, 20% of the causes generate 80% of the effects.
This means that if we can identify and optimize the "20%" responsible for our work, we can theoretically achieve "the" 80% increase in performance.
So I collected a day's worth of logs. In total, approximately 3 million requests passed through the server.
Using a Bash script, we can easily extract only the requests related to maps and sort them by country:
## sed -n 's/.*\/260405\/\([^_.]*\).*/\1/p' access.log | sort | uniq -c | sort -nr | awk '{cnt[NR]=$1; name[NR]=$2; total+=$1; lines=NR} END {for(i=1;i<=lines;i++)
printf "%8d %6.2f%% %s\n", cnt[i], (cnt[i]/total)*100, name[i]}'
  934949  32.25% France
  532499  18.37% Germany
  252621   8.71% US
  148178   5.11% Italy
   98293   3.39% Netherlands
   86948   3.00% Spain
   61763   2.13% Belgium
   57862   2.00% Austria
   53080   1.83% Switzerland
   51552   1.78% World (* Includes the "general" map and country borders)
   50985   1.76% Canada
   49935   1.72% UK
   [... altri stati qui ...]
The logs are clear: 80% of the traffic comes from just 12 out of 220 states. In our case, 5% accounts for 80% of the traffic. We can therefore focus on optimizing this small portion to achieve significantly better results.
Unused RAM is wasted RAM
Right from the beginning, a system inefficiency became apparent: most requests were reading directly from the disk. While this operation was efficient thanks to the use of SSDs, it would certainly have caused slowdowns if there had been other concurrent workloads.
The cause was simple: Linux heavily uses free RAM as a disk cache, and the container dedicated to the web server had only 512MB allocated. Since a large portion of the memory was occupied by the system itself, the server was forced to "discard" the data it had just read without being able to keep it in memory.
By giving Linux the right amount of RAM, however, we can ensure it makes the most of it by filling it with the "hottest" data coming from the disk.
This "fullness" is actually only apparent, and in fact, the memory used for caching can be freed up immediately if another piece of software needs it. Not everyone is aware of this, and there is even a dedicated website that explains the concept.
So, what does the 5% identified earlier correspond to? We can find out by adding up the size of all the stated identified earlier:
## du -ch France_* Germany_* US_* Italy_* Netherlands_* Spain_* Belgium_* Austria_* Switzerland_* World* Canada_* UK_*
[...]
38.7G   total
I therefore allocated about 40 GB of RAM to the web server, so that the system could keep most of those files in memory. Within a few hours, the system reported that it had used 39.3 GB (buff/cache column).
## free -h
              total        used        free      shared  buff/cache   available
Mem:         125.7G       39.4G        3.0G        1.9G       39.3G       40.3G
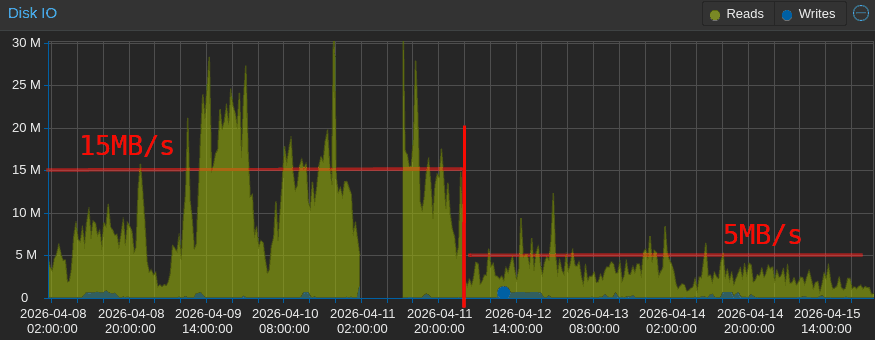
This caused an immediate drop in disk usage, which fell from an average of 15 MB/s with peaks of 60 MB/s to a steady rate of about 5 MB/s with peaks of 10 MB/s (roughly one-third of the original), with the curve continuing to decline as the algorithm optimized the most frequently accessed files.

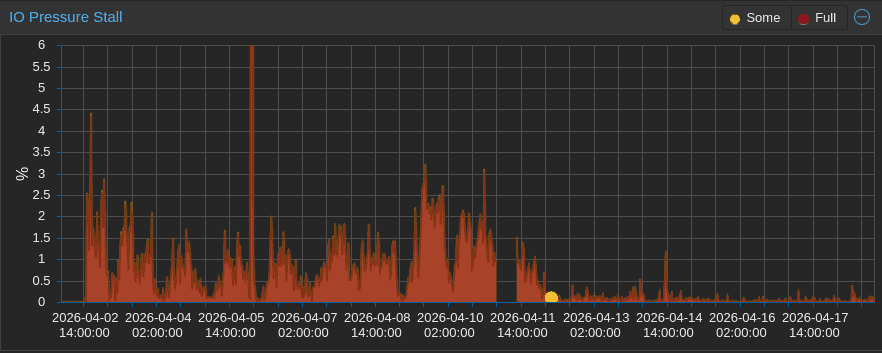
The beneficial effect of the additional RAM is even more evident in the I/O pressure graph, which shows the percentage of time "wasted" waiting for the disks to become available.

Who needs atime?
Now that we've addressed the issue of frequent reads, there's another factor to consider: frequent writes.
Even though reading a file doesn't usually involve any write, its metadata includes the last time it was accessed.
This information is updated by the operating system and can be viewed using the stat command:
## stat World.mwm
  File: World.mwm
  Size: 53104836        Blocks: 103728     IO Block: 4096   regular file
Device: 800h/2048d      Inode: 5518608     Links: 1
Access: (0644/-rw-r--r--)  Uid: ( 1000/ UNKNOWN)   Gid: ( 1000/ UNKNOWN)
Access: 2026-04-18 10:28:45.836942564 +0000
Modify: 2026-04-06 07:03:48.000000000 +0000
Change: 2026-04-07 07:01:31.892520553 +0000
This means that every time a file is downloaded - even if the file is already in RAM - a small write operation updates that value. This is useful for auditing purposes or to maintain a list of recent files, but in our case, since every file is accessed continuously anyway, it becomes completely meaningless.
It's not much traffic, but you can still disable it by adding the noatime or lazyatime mount options.
These two options must be added to the /etc/fstab file and have the following effects on access time:
noatime: the field is never updatedlazyatime: the field is updated only when a modification occurs (which would have triggered a write anyway) or 24 hours after the last update of access time
In my case, I enabled lazyatime across the entire filesystem: an approximate access time can be useful for determining whether certain files are in use or not, and the access logs still allow you to retrieve the exact timestamps if necessary.
Those continous writes
I had never noticed it before, but all of the web server's write traffic was caused by the access.log file, which was updated with every visit. Each request generated a line, and each line resulted in a write operation to the file.
Nginx provides three additional options to add to the logging settings:
access_log /var/log/nginx/access.log privacyfmt gzip buffer=32k flush=10m;
Here is the effect of each of these:
gzip: The entire log is compressed on the fly using gzip (level 1). In my case, 758MB of logs are reduced to 34.4MB (22 times smaller)buffer=32k: Logs will only be written to disk once 32KB of pending logs have accumulated...flush=10m: ... or until 10 minutes have passed since the last write
The only downside to this approach is the possibility of losing up to 10 minutes of logs in the event of a server crash. I have no interest in keeping such granular logs, so I applied these directives globally.
Note: In the end, I disabled CoMaps policy logs anyway. Initial logging was done using a format that did not include IP addresses or User-Agents (privacyfmt).
Conclusions
Making the node available for CoMaps is not only a way to contribute to an open-source project, but also an opportunity to learn about the challenges posed by specific types of traffic, such as those generated by this app.
Despite the significant traffic, the presence of other nodes helps effectively distribute the traffic well below the saturation threshold. Clients are designed to download from as many nodes as possible simultaneously and retry in case of an error.
Even if there was a need to limit traffic in the future, the load balancing of the clients would adapt dynamically by spreading the load on other faster nodes.
I'm happy to provide this node, and I invite you to contribute even if it's just by downloading the app to try it out and leaving a review. CoMaps is a relatively new project and needs a lot of help on all fronts!